- Nhận đường liên kết
- X
- Ứng dụng khác
Litecoin Price Prediction – December 27
The Litecoin price prediction reveals that LTC records a gain of 2.42%, as the coin is seen approaching the $160 level.
LTC/USD Market
Key Levels:
Resistance levels: $185, $195, $205
Support levels: $130, $120, $110
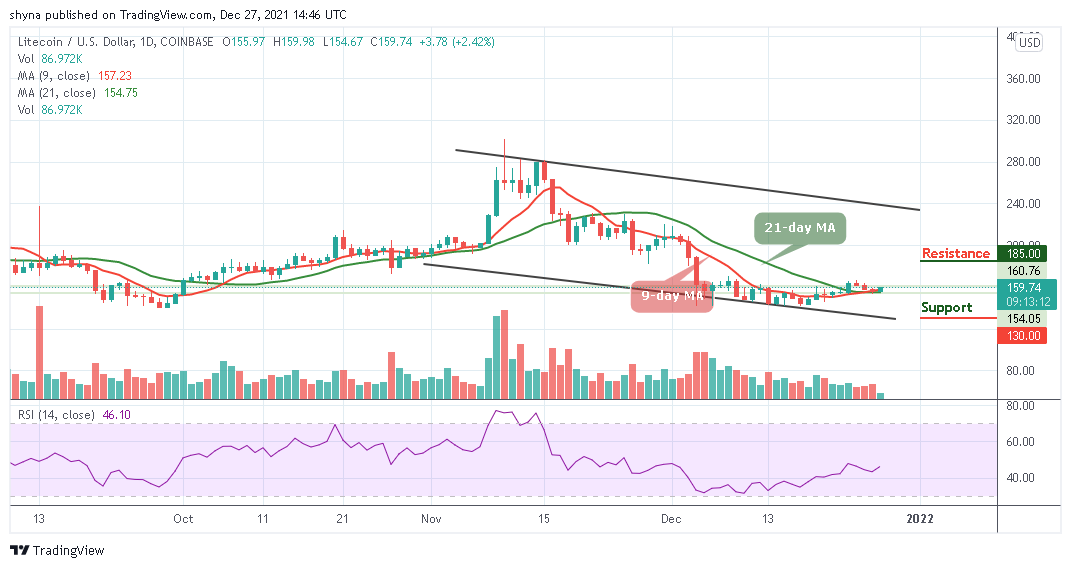
LTCUSD – Daily Chart
LTC/USD is seen trading in the green at the time of writing as the coin is trading above the 9-day and 21-day moving averages with a gain of 2.42%. According to the daily chart, the candle formations are likely to respect the upward movement but crossing below the moving averages might position the market price in a decline. Meanwhile, the closest support level is located around $140 level while a north wave might see a high movement towards the upper boundary of the channel.
Litecoin Price Prediction: Litecoin Price May Follow the Uptrend
As the daily chart reveals, the Litecoin price is following the bullish movement as the coin hits the daily high at $160. Meanwhile, an increase above this level could trigger intense buying to $185, $195, and $205 resistance levels. On the contrary, the Litecoin price may likely hold a support level at $155 which is the current daily low. Therefore, if the Litecoin price drops below this support level, it may likely hit the closest support at $140.
Meanwhile, the next support after this is located below the lower boundary of the channel where it may dip to the supports at $130, $120, and $110 if the selling volume keeps increasing. More so, the technical indicator Relative Strength Index (14) reveals that the market may likely cross above 45-level if the signal line keeps pointing to the north.

When compares with Bitcoin, the sellers are making an attempt to step back into the market while the coin remains below the 9-day and 21-day moving averages. Meanwhile, from the upside, the nearest level of resistance lies at 3500 SAT and above as the technical indicator Relative Strength Index (14) plans to cross above 40-level.
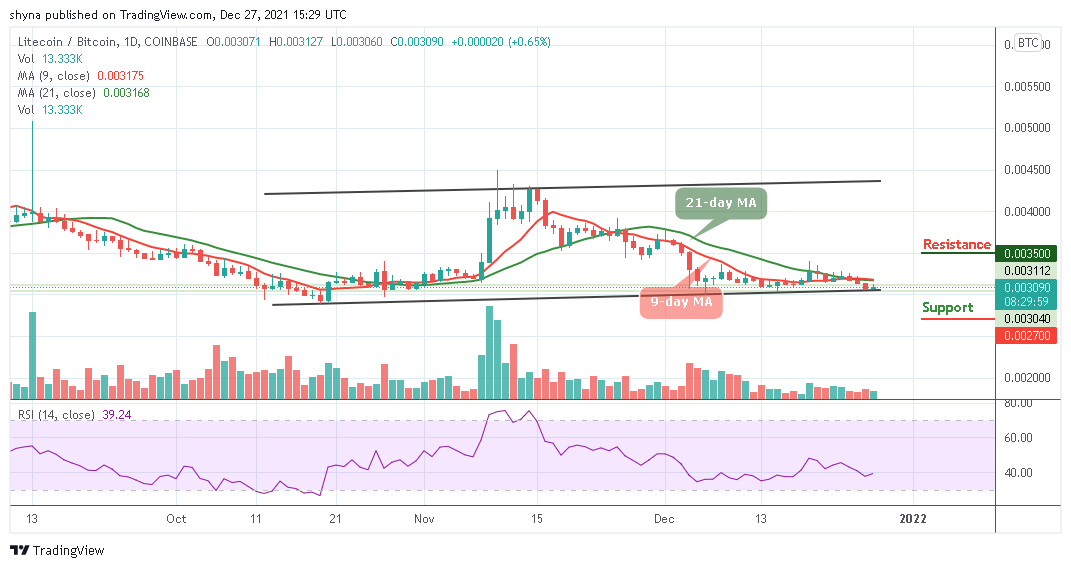
LTCBTC – Daily Chart
Therefore, looking at the downside; the nearest support level is located at 2800 SAT, if the price drops further to create a new low, lower support could be found at 2700 SAT and below. In addition, the 9-day MA is still very close to the 21-day MA, which shows that the market may soon choose the direction it will follow.
Looking to buy or trade Litecoin (LTC) now? Invest at eToro!
68% of retail investor accounts lose money when trading CFDs with this provider
Nhận xét
Đăng nhận xét