- Nhận đường liên kết
- X
- Ứng dụng khác
Ripple Price Prediction – February 2
The Ripple price prediction keeps moving below the moving averages. The coin heads toward the lower boundary of the channel.
XRP/USD Market
Key Levels:
Resistance levels: $0.72, $0.74, $0.76
Support levels: $0.52, $0.50, $0.48

XRP/USD may be stagnant, trending in a tight trade range as it moves below the key supports. The coin may likely revisit the $0.55 support before it could start a new increase, but after struggling to stay above the 9-day moving average, Ripple (XRP) begins a slow and steady decline towards the south. According to the technical indicator, the coin may hit the nearest support at $0.58 to move into a short-term bearish zone.
Ripple Price Prediction: Ripple (XRP) May Remain within the Negative side
At the time of writing, the Ripple price is currently exchanging hands at $0.59, and any attempt to make it cross below $0.57 may likely open the doors for more downsides, and the price could spike below the $0.54 support level. However, traders may need to keep their eyes on the $0.65 before creating a new bullish trend at the resistance levels of $0.72, $0.74, and $0.78.
Moreover, traders may experience a quick buy once the trade reaches the support at $0.55, but, if the price fails to rebound, a bearish breakdown is likely to trigger more selling opportunities for the market, which might cause the price to test the critical supports at $0.52, $0.50, and $0.48. Meanwhile, the technical indicator Relative Strength Index (14) is likely to return into the oversold territory, Ripple (XRP) may continue to fall more or follow a sideways movement.

Compared with BTC, the Ripple (XRP) moves at the downside within the channel. If the selling pressure persists, the Ripple price may bring a new low into the market. Presently, the technical indicator Relative Strength Index (14) is moving towards 40-level; more positive moves may come to play as the pair moves near the 9-day moving average.
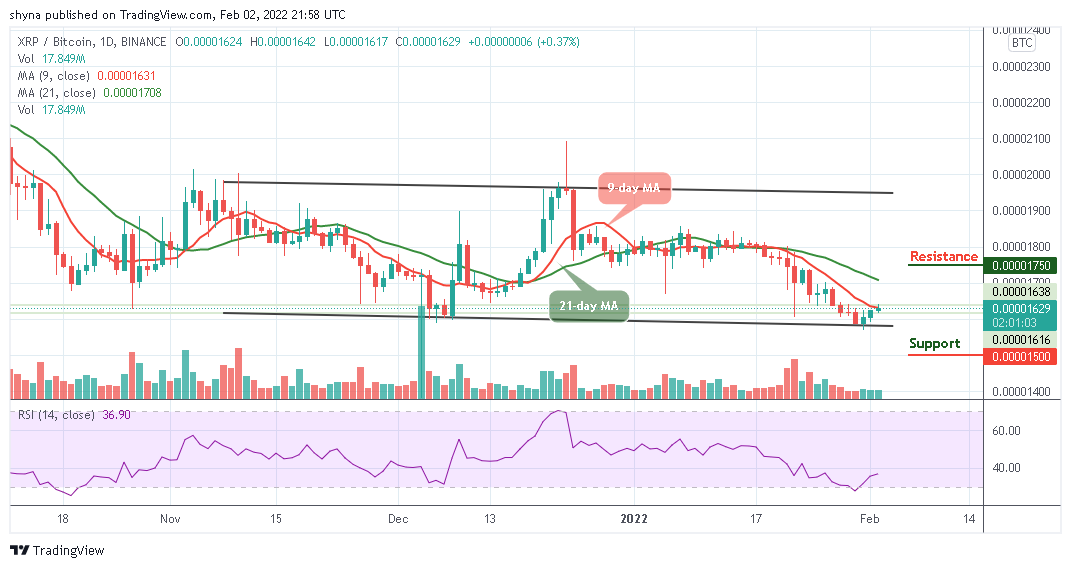
However, traders may expect close support below the moving averages at the 1600 SAT before breaking to 1500 SAT and critically 1400 SAT. If a bullish movement surfaces, validating a break above the 21-day moving average may confirm a bullish movement for the market, and the nearest resistance level may be located at 1750 SAT and above.
Looking to buy or trade Ripple (XRP) now? Invest at eToro!
68% of retail investor accounts lose money when trading CFDs with this provider
Nhận xét
Đăng nhận xét