- Nhận đường liên kết
- X
- Ứng dụng khác
After breaking above the 9-day and 21-day moving averages, the Binance Coin price prediction faces the resistance level of $350.
Binance Coin Prediction Statistics Data:
- Binance Coin price now – $329
- Binance Coin market cap – $53.7 billion
- Binance Coin circulating supply – 163.2 million
- Binance Coin total supply – 163.2 million
- Binance Coin Coinmarketcap ranking – #4
BNB/USD Market
Key Levels:
Resistance levels: $400, $420, $440
Support levels: $250, $230, $210
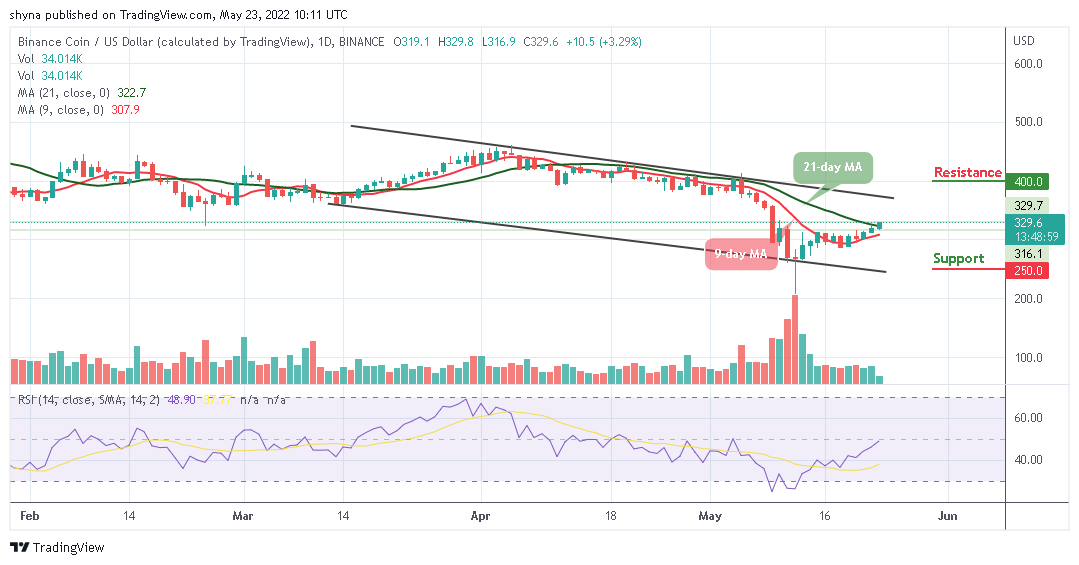
BNB/USD is currently trading at $329 after touching the daily low of $316.9 and climbing above the 21-day moving average. However, in case the buyers were able to push the price above the resistance level of $350, and the daily candlestick closes above this level, the price may rally towards the upper boundary of the channel.
Binance Coin Price Prediction: Binance Coin Ready to Shoot Up
Looking at the daily chart, the 9-day moving average is attempting to cross above the 21-day moving average as the Binance price is likewise moving close to the resistance level of $350, which connotes that the buyers may gain upper hand in the market. The technical indicator Relative Strength Index (14) is likely to cross above 50-level with the signal line pointing up to indicate a buy signal.
However, in case buyers were able to push the price above the upper boundary of the channel and the daily candlestick closes above this barrier, the Binance Coin price may rally towards potential resistance levels of $400, $420, and $440 while crossing below the moving averages may bring the coin to the supports at $250, $230, and $210 respectively.

BNB/BTC Market: Price Heads to the Upside
Compared with Bitcoin, the coin is following a bullish surge, and it may swing high to cross above the upper boundary of the channel which could locate the resistance level of 1150 SAT and above. On the other hand, if the market price crosses below the 9-day and 21-day moving averages, it could reach the support level of 1000 SAT and below.
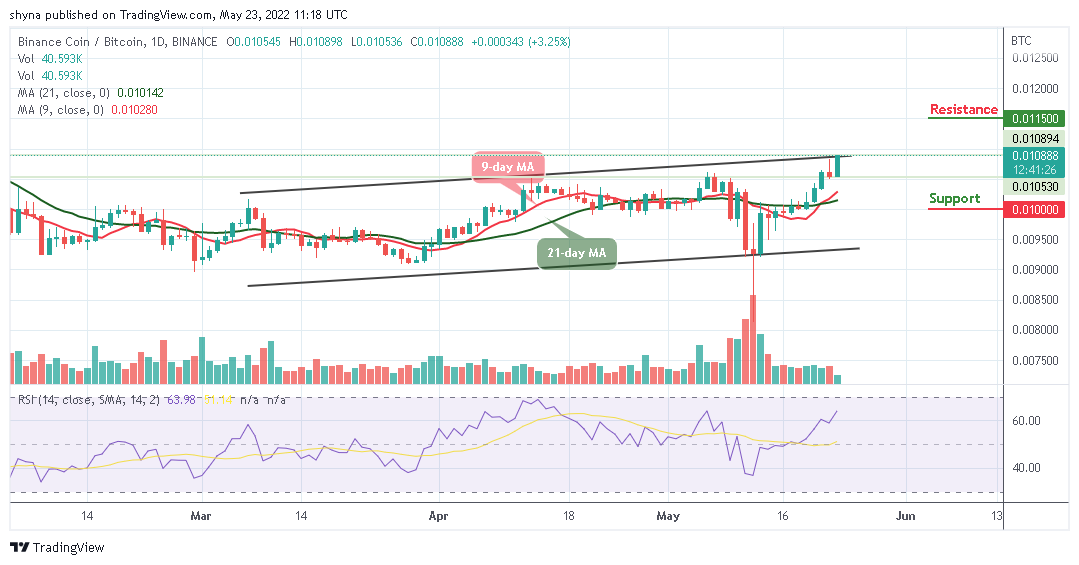
However, the technical indicator Relative Strength Index (14) is currently moving above the 60-level as the signal line points to the north to confirm the bullish movement. Meanwhile, any further bullish movement may create additional gains above the channel.
Looking to buy or trade Binance Coin (BNB) now? Invest at eToro!
68% of retail investor accounts lose money when trading CFDs with this provider
Read more:
- How to buy Cryptocurrency
Nhận xét
Đăng nhận xét