- Nhận đường liên kết
- X
- Ứng dụng khác
- Nhận đường liên kết
- X
- Ứng dụng khác
Join Our Telegram channel to stay up to date on breaking news coverage
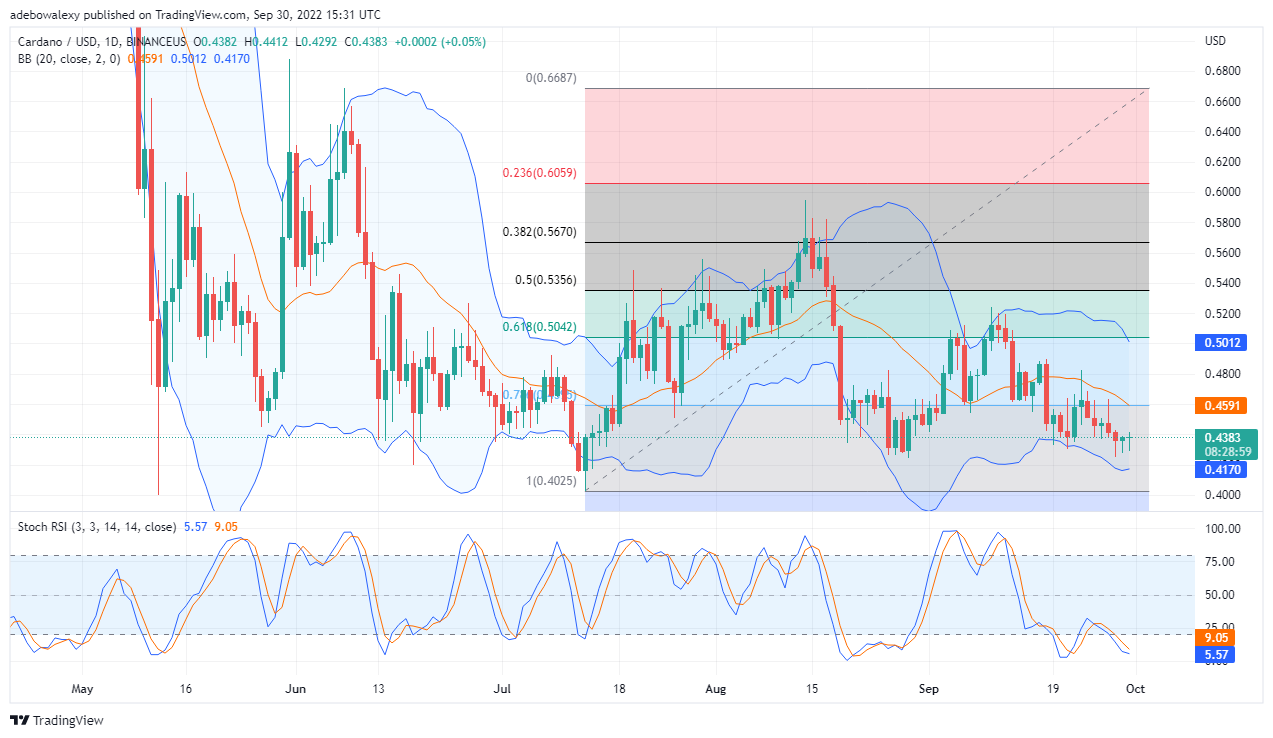
The ADA/USD price action has attempted to find strong support at the Fibonacci Level of 76.40. Nevertheless, this attempt failed as price action now reclines below this support. However, going by trading indicators ADA/USD price move is now preparing to push upwards, perhaps this time it will be successful in finding a base.
ADA’s Analysis Statistics Data:
Cardano’s value now: $0.4383
ADA’s market cap: $14.82 billion
ADA’s moving supply: 34.24 billion
The Total supply of Cardano: 34.97 billion
Cardano’s Coinmarketcap ranking: #8
Furthermore, we will extend our price analysis to the ADA/BTC market. And we shall try to come up with helpful trading decisions.
Important Price Marks:
Resistance Marks: $0.4383, $0.4403, $0.4443
Support Marks: $0.4353, $0.4323, $0.4300

Cardano’s Price Analysis: ADA/USD Eying 76.40 Fib Level as a Support
ADA/USD failed attempt to find a base at the above-mentioned Fib level has caused the crypto’s price to fall to $0.4383. Although the current price of Cardano falls under the MA of the Bollinger band, buyers are currently making efforts to push the price towards the MA, and perhaps above it. Additionally, the RSI lines have reached the oversold and are now shaping to indicate a gain in upside momentum. Nevertheless, more buying pressure will be needed to initiate the envisaged upside correction. Should buyers continue to gain the upper hand price action will climb towards and above the 76.40 Fib level. And eventually, price action may find support at this level, which will bring the price to $0.4591.


Cardano’s Price Analysis: ADA/BTC May Rebound Upwards
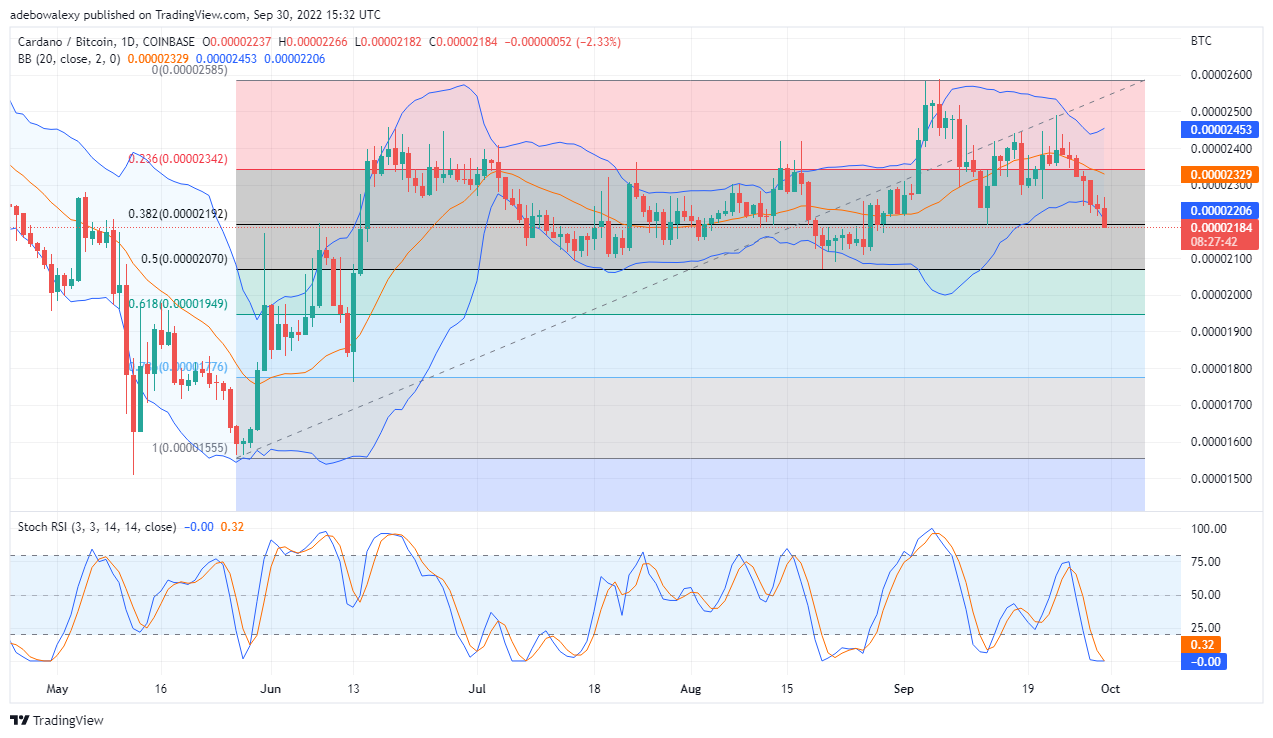
On the ADA/BTC daily chart, after price action was tested the 0 Fib level price action was rejected to the downside. There have been occasional breaks, but recently price in this market has been strongly bearish. Furthermore, the bears have been able to break down the 38.20 Fib level with the last candle on this chart. At this point, price action has significantly pushed the floor of the Bollinger band. And the rule of this Indicator follows that an upward Rebound will occur following this.
Buy Cardano Now
Your capital is at risk.
To support this, the line of the RSI is now touching at their tips to indicate a possible rebound. Nevertheless, since we can’t tell the strength of the rebound, it is best to catch it when the rebound is significant to avoid fake-outs. Therefore, traders can place a pending long order above the 38.20 Fibonacci level, perhaps around 0.00002236 or higher.
Tamadoge - Play to Earn Meme Coin
Our Rating
- Earn TAMA in Battles With Doge Pets
- Maximum Supply of 2 Bn, Token Burn
- Now Listed on OKX, Bitmart, Uniswap
- Upcoming Listings on LBank, MEXC
Visit Site
Join Our Telegram channel to stay up to date on breaking news coverage
20 fib level
40 fib level
4383 ada&rsquo
4443 support marks
analysis
coin news
cryptocurrency news
current price
find support
moving supply
price action
price analysis
recently price
- Nhận đường liên kết
- X
- Ứng dụng khác
Nhận xét
Đăng nhận xét