Reason to trust

How Our News is Made
Strict editorial policy that focuses on accuracy, relevance, and impartiality
Ad discliamer
Morbi pretium leo et nisl aliquam mollis. Quisque arcu lorem, ultricies quis pellentesque nec, ullamcorper eu odio.
Ethereum is trading above the $2,500 mark but continues to struggle with strong resistance near $2,600, a key level that has capped further upside in recent sessions. After gaining over 23% since June 22, ETH has shown signs of strength, reclaiming crucial levels and riding the wave of market-wide optimism. However, as the broader crypto market stalls, Ethereum’s momentum appears to be slowing down.
Litecoin Surges Past Descending Resistance – Bulls Target $97.10 Level
The bullish impulse that drove ETH higher in late June is now meeting headwinds. Despite holding above important moving averages and maintaining a short-term uptrend, Ethereum has failed to break decisively above the $2,600 barrier. Analysts warn that a failure to reclaim this level with strong volume could lead to a short-term correction.
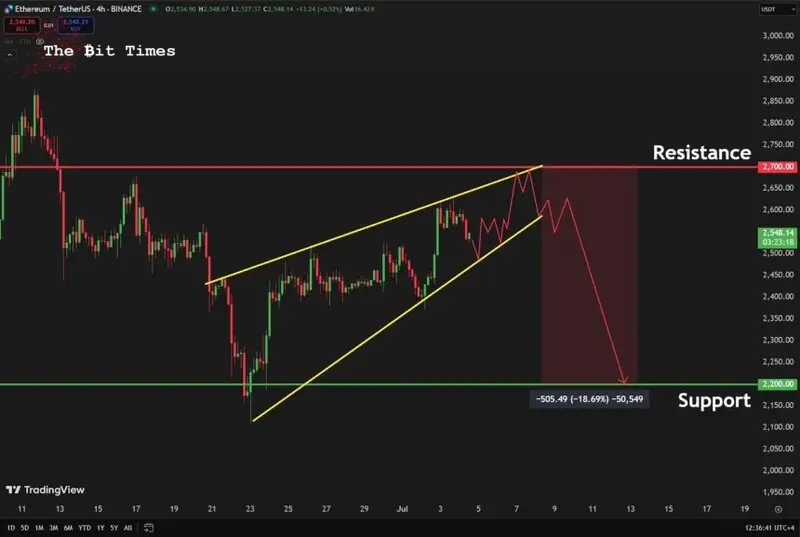
Top analyst Carl Runefelt shared insights indicating a potential bearish setup on the 4-hour chart. According to Runefelt, Ethereum is forming a pattern that could lead to a pullback toward lower demand zones if momentum continues to fade. The coming days will be critical, as bulls attempt to maintain control while bears eye an opportunity to reclaim short-term dominance.
Ethereum Faces A Critical Level
Ethereum is approaching a crucial juncture following a week marked by volatility and renewed bullish momentum. After reclaiming the $2,500 level and rising over 23% since June 22, ETH has regained the attention of investors. However, the rally now faces a critical test: breaking above the $2,700 resistance level. A successful move above this threshold could ignite a broader altcoin rally, as Ethereum often acts as the leader for the altcoin market.
Market sentiment remains cautiously optimistic, with bulls appearing to control short-term price action. Ethereum is trading above key moving averages and remains structurally bullish on higher timeframes. Yet, price has stalled just below the $2,600–$2,700 zone—a key supply area that must be flipped into support to confirm the next upward leg. A clean breakout could propel ETH into a new price range, allowing other altcoins to follow and break above their own resistance levels.
Carl Runefelt cautions that Ethereum is currently forming a rising wedge pattern on the 4-hour chart—a potentially bearish setup. If the pattern plays out, ETH could fail to break higher and instead fall back toward lower support zones. Runefelt points to the $2,200 level as a key horizontal support that could be tested if momentum weakens and sellers regain short-term control.
For now, Ethereum’s price action remains in a tight range. A decisive breakout or breakdown will likely define the direction of the altcoin market in the weeks ahead. Traders and investors alike are closely watching ETH’s next move, as it could set the tone for the remainder of the summer crypto cycle.

Ethereum Looks Strong Despite Volatility – $10,000 Price Target Gains Momentum
ETH Price Analysis: Key Resistance At $2,600
Ethereum’s price action continues to reflect a tug-of-war between bulls and bears as it hovers around the $2,550 level, just under the critical resistance at $2,600. After reclaiming that level briefly, ETH failed to hold its gains and pulled back slightly, suggesting sellers remain active at this zone. The chart shows Ethereum forming a lower high in the near term, raising short-term caution among traders.
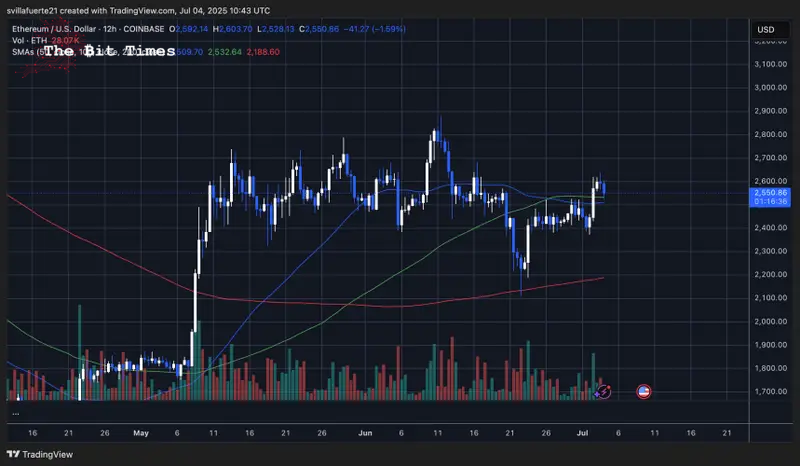
The 50-day and 100-day simple moving averages are now converging around $2,500–$2,530, acting as immediate support. As long as ETH holds above these levels, the medium-term outlook remains constructive. However, any sustained drop below these moving averages could invite additional downside pressure, possibly dragging the price back toward the $2,400 range or even testing the 200-day SMA near $2,180.

Bitcoin Bounces Off Key Demand Level – Price Discovery On The Menu?
Volume has remained moderate, showing that neither side has taken full control. Until ETH decisively breaks above $2,600 and flips it into support, the uptrend remains unconfirmed. The next key resistance sits at $2,700. Conversely, a rejection from current levels could indicate the formation of a range-bound structure or a rising wedge breakdown, as some analysts like Carl Runefelt suggest.
Featured image from Dall-E, chart from TradingView
Nhận xét
Đăng nhận xét